For years, tracking where New York City's public-construction dollars were actually going meant digging through thousand-page budget PDFs, cross-referencing agency press releases, and knowing someone who knew someone. That is starting to change. The MTA and the City have both put capital-project data online in interactive dashboards, and a recent watchdog report is pushing every agency to publish more. For contractors chasing public work — SCA, MTA, DDC, NYCHA, DASNY — these tools are quietly becoming a business-development advantage.
Here's what launched, what it shows, where the gaps still are, and how a disciplined firm can put it to work.
Why capital-project transparency matters right now
Public agencies in New York commit billions of dollars a year to build, repair, and modernize schools, transit, housing, and civic infrastructure. Historically, that spending was disclosed in formats built for budget analysts, not builders. The City's Ten-Year Capital Strategy and Capital Commitment Plan are released as sprawling multi-volume PDFs — the kind of document you can technically download but not easily search for the one project relevant to your trade.
In December 2025, the Office of the New York City Comptroller published a report, Flying Blind on Billions: How Weak Capital Data Undermines New York City's Infrastructure Investments, arguing that the City's capital data is incomplete, inconsistent across agencies, and fragmented across separate project-management systems. Among its findings, the report noted that the City's own Capital Projects Dashboard captured only a portion of the projects and planned commitments listed in the official Capital Commitment Plan — a coverage gap worth confirming against the report before you rely on it.
The takeaway for contractors isn't the politics. It's the direction of travel: the pressure is on agencies to make project pipelines more visible, more structured, and more usable. Firms that learn to read these tools early will spot work sooner than firms still waiting for a solicitation to hit their inbox.
The MTA Capital Program Dashboard
The most contractor-friendly tool to arrive recently is the MTA's redesigned Capital Program Dashboard (a beta at capitaldashboard.mta.info). It covers construction across the MTA's operating agencies — New York City Transit, Long Island Rail Road, Metro-North Railroad, and Bridges and Tunnels.
What makes it useful is the shift in how projects are organized. Instead of leading with internal budget codes, the dashboard groups work into project bundles meant to reflect how the MTA actually coordinates, contracts, and executes the work. For an estimator or a business-development lead, that's the difference between a spreadsheet of accounting line items and a picture of real scopes you could bid.
For a given project the dashboard is designed to show what is being built or replaced, where it is located, the budget, how much has been spent to date, and the expected completion. The current release includes accessibility projects in construction, work in the procurement pipeline, and candidate locations tied to the 2025–2029 Capital Plan — with the MTA continuing to add projects and inviting public feedback as it refines the tool. Treat the specific data-release schedule as something to confirm on the site, since the MTA has described the rollout as ongoing.
Used well, the dashboard is a pipeline radar. A subcontractor in elevators and accessibility work, for instance, can see where ADA station projects are clustered and when they're expected to hit procurement — intelligence that shapes which pursuits to staff up for.
The City's Capital Projects Dashboard — and its limits
The City runs its own Capital Projects Dashboard (through nyc.gov/site/capitalprojects), covering managed capital work across City agencies. It's a genuine step toward transparency, and it's worth checking alongside agency-specific portals.
But the Comptroller's report is a useful caution: a public dashboard is only as good as the data feeding it. If a meaningful share of projects or planned commitments never makes it into the tool — and the report suggests that's the case for the City dashboard — then what you see is a partial map, not the whole territory. Separately, initiatives like the Department of Design and Construction's move toward GIS-based capital planning point to where this is heading: unified, mapped, queryable project data. For now, though, no single dashboard is a complete source of truth.
That's not a reason to ignore these tools. It's a reason to triangulate.
How MODRN reads these tools (and how you can too)
At MODRN we treat public dashboards as one input in a disciplined pipeline process — never the only one. A few working principles:
Cross-check every lead. A project bundle on the MTA dashboard or an entry on the City dashboard is a signal, not a solicitation. Confirm it against the agency's official bidding channel — SCA Bidset and the SCA InfoHub for school work, the MTA's procurement listings for transit, and each agency's own advertised-bid pages — before you commit estimating hours.
Read the whole record, not the headline number. A budget figure without a schedule tells you little. Note the completion window, the spent-to-date figure, and where a project sits in the pipeline. That context tells you whether a pursuit is imminent or years out.
Build a watchlist by trade and geography. The real value compounds over time. Track the bundles and locations that match your scope and revisit them on a cadence, so you see movement — a candidate location advancing toward procurement — before your competitors do.
Don't mistake coverage for completeness. Because these dashboards don't yet capture every project, absence from a dashboard doesn't mean a job doesn't exist. Keep your traditional sources — agency ad pages, plan rooms, and relationships — running in parallel.
Turning visibility into won work
Transparency tools lower the cost of finding public work. They do nothing to lower the cost of losing a bid you weren't ready for. The firms that benefit most from NYC's new dashboards will be the ones that pair better pipeline intelligence with disciplined estimating, clean submittals, and airtight contract administration — the parts of the job that decide whether a public project makes or loses money.
That's the work MODRN does every day: turning a noisy field of public opportunities into a focused, defensible pursuit list, and then executing the bid and the project behind it with audit-ready rigor.
If your firm wants help building a repeatable public-work pipeline — from spotting the right projects to submitting a competitive, compliant bid — reach out through our contact page or explore our estimating and contract-administration services.
This article is provided for general informational purposes and reflects publicly reported information as of July 2026. Agency dashboards, capital plans, budgets, and program details change frequently; always verify project data, budgets, schedules, and bidding requirements against the official agency source before making business decisions.
Sources: NYC Comptroller — Flying Blind on Billions · MTA — Capital Program Dashboard press release · MTA Capital Program Dashboard · NYC Capital Projects Dashboard · Metro Magazine — MTA Launches New Capital Program Dashboard
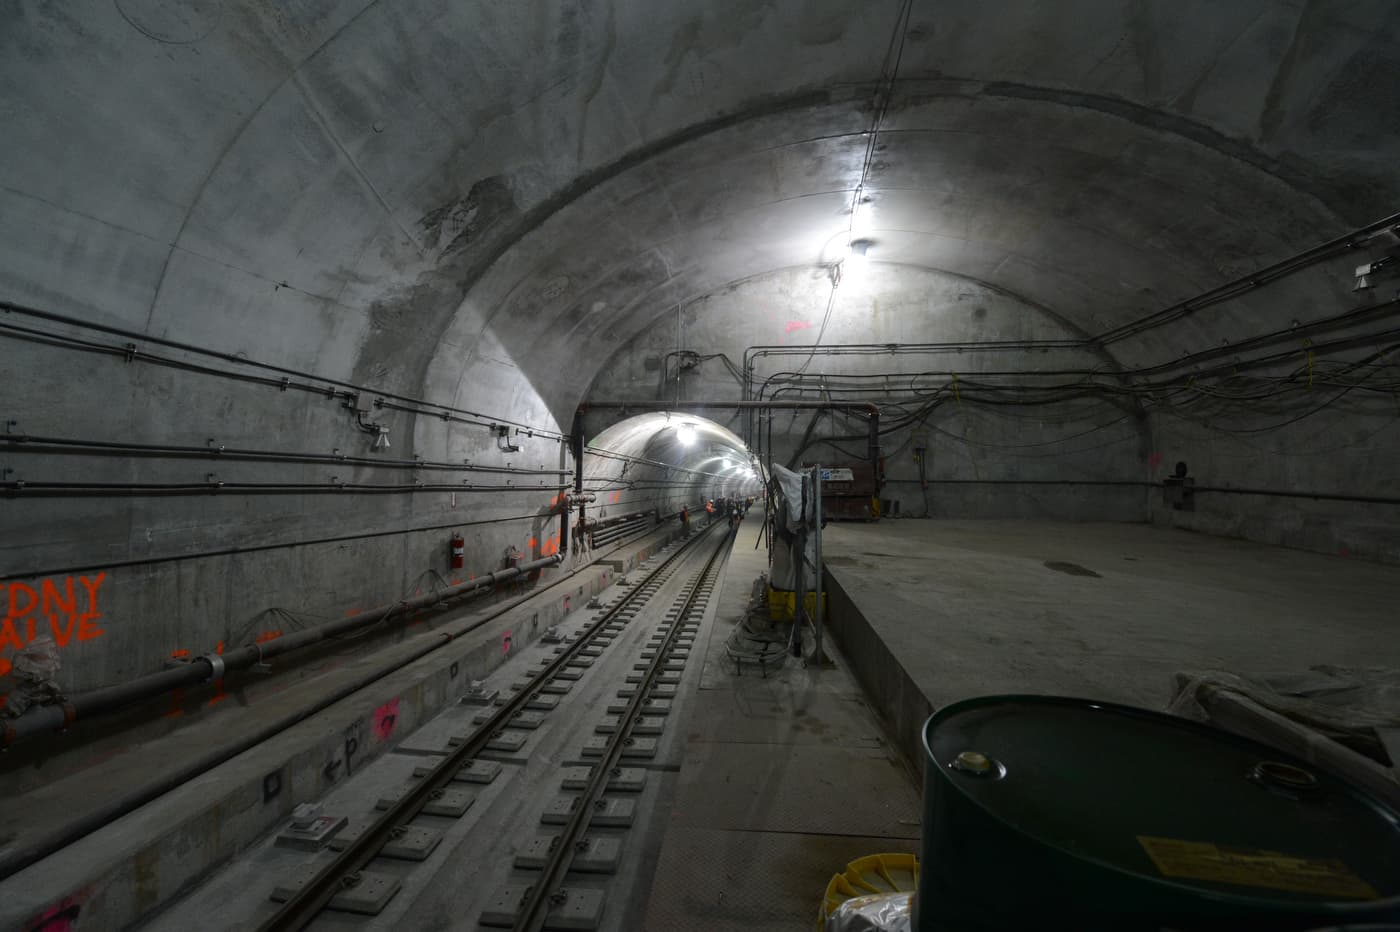
Featured image: Second Avenue Subway Phase I under construction on Manhattan's Upper East Side — an MTA capital project. Metropolitan Transportation Authority of the State of New York (photo: Marc A. Hermann / MTA New York City Transit), via Wikimedia Commons, CC BY 2.0. Used unmodified.
Comments
0 commentsChecking your Nexus session…
Loading comments…